Update, September 4, 2026: the launch arrived with 45 Cybercabs registered in Texas and 420 Tesla Robotaxi vehicles in the state altogether, but no national deployment rate. We rebuilt the year-end range city by city: 2,500 at P10, 7,550 at P50 and 14,100 at P90, including Model Y and Cybercab.
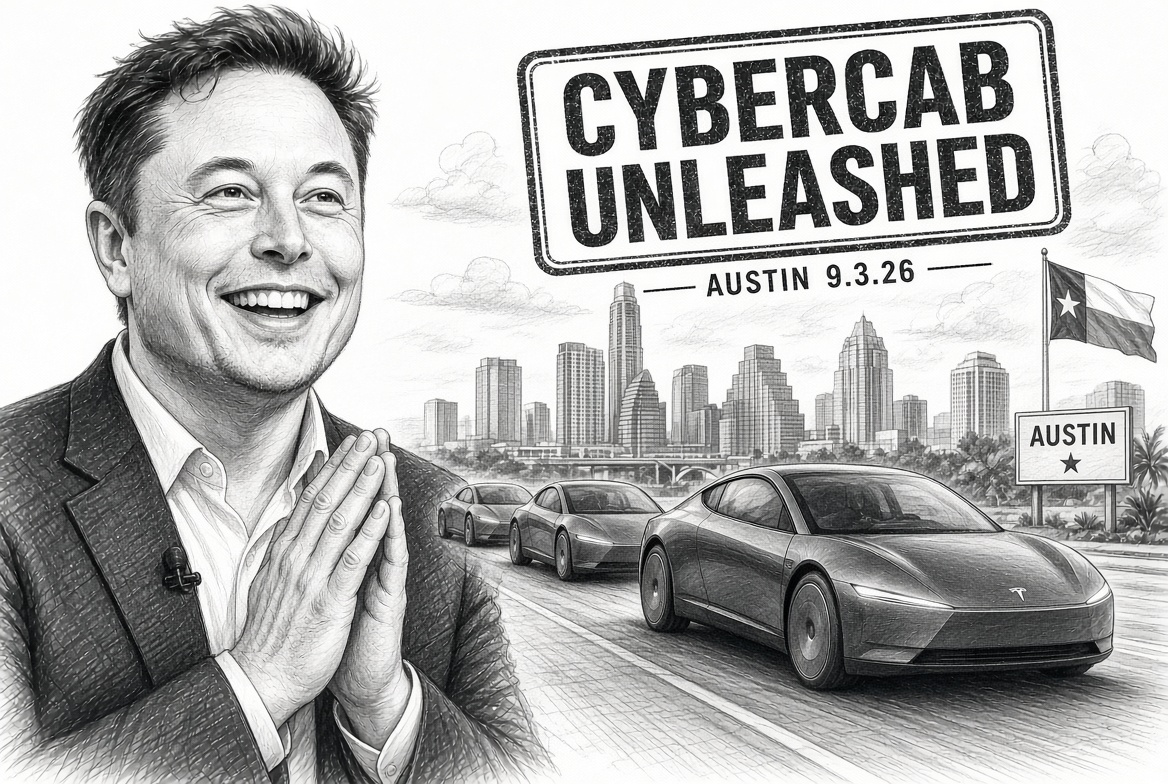
Tesla has confirmed a Cybercab launch event for September 3 in Austin. Invitations went out by email this week, allocated through a sweepstakes tied to robotaxi rides taken between August 17 and 23, with winners told on August 25. The date is the new fact, and it is the first dated, gradeable Cybercab checkpoint since we published our deployment ramp.
It is also, plainly, a step in the right direction: a purpose-built two-seater with no steering column and no pedals is about to be shown as a product with a date attached rather than as a prototype with a year attached.
But the number worth writing down before September 3 did not come from the invitation. It came from a hearing in Nevada two weeks earlier, and it is the first time Tesla has put a figure on how fast it intends to add cars rather than how many it is allowed to run.
The five figures this piece turns on
- September 3, Austin — the event date, from Tesla's own invitation emails. Reported by multiple outlets from the invitations themselves; treat the date as firm and the content as unknown.
- 2,500 vehicles in twelve months — Tesla's Cybercab chief engineer at the Nevada Transportation Authority hearing on August 20, describing Clark County: the 5,000 ceiling "has always been a ceiling", and the company "would be extremely happy and satisfied" at 2,500. Said at a hearing, not guided in a filing.
- 3,315 vehicles — the additions our own model makes across every market in its first four quarters. Ours, not Tesla's.
- 186 vehicles — the registered robotaxi fleet in Texas, all Model Y. A crowd-sourced tracker count, not a company disclosure, and registrations are not the same as cars earning on a given day.
- ~245 Cybercabs — the highest single staging count observed at Giga Texas, mid-July, by spotters. An observation of a parking lot, not an output figure.
Where the cars are, as far as anyone outside Tesla can see
Nobody outside the company knows how many Cybercabs exist. What exists publicly is a set of parking-lot observations, drone counts and registry pulls, and they disagree with each other. The honest version is a range with its provenance attached:
| Location | Cybercabs seen | Model Y robotaxi | Status |
|---|---|---|---|
| Giga Texas | 102 Jun → ~245 Jul | — | Staged, test track |
| Austin | Dozens | 186 registered, Texas total | Live service, event host |
| Houston | ~80 Jun → ~140 Aug | Dozens active | Staging lots |
| Dallas | 50–55 Jun → ~105 Aug | Single digits active | Staging lots |
| Charlotte | ~14 | ~14, Texas plates | Prep |
| Florida metros | Singles | Small fleets | Validation |
Every cell above is an observation by someone standing outside a fence or querying a registry. None of it is a Tesla figure, and the vehicles move between the factory, staging lots and hubs, so the same car can be counted twice in a month. What the table supports is a shape, not a total: Cybercabs are accumulating in Texas lots faster than they are entering service anywhere. That is the same finding our ramp piece reached from the other direction, and the launch event does not change it.
The conversion: 2,500 is a rate, and it is the first one
The Nevada permit was a ceiling, and we already priced it: moving our model's starting fleet from 1,000 to the full 5,000 is worth 33 cents a share against a $272.39 base case. Ceilings are cheap.
The 2,500 is a different kind of number. It is Tesla describing the pace it thinks it can actually achieve in its most permissive new market, in a twelve-month window, under oath-adjacent conditions in front of a regulator. That makes it comparable to the one assumption in our Tesla model that actually drives the line: not the fleet we start from, but the rate we grow it at.
Our model adds 600 vehicles in the first quarter of Cybercab deployment, compounding at 22% a quarter. Both numbers are ours. Over four quarters that is:
| Quarter | Additions | Cumulative |
|---|---|---|
| First | 600 | 600 |
| Second | 732 | 1,332 |
| Third | 893 | 2,225 |
| Fourth | 1,090 | 3,315 |
3,315 vehicles across every market Tesla operates in, in year one. Tesla's own stated ambition for Clark County alone is 2,500 — 75% of our global first year, in one county. At that rate it takes 1.33 metros to exhaust everything our model builds everywhere in twelve months.
Austin is the flagship, not the fallback. If it runs at anything like the pace Tesla told Nevada it hopes for, then Austin and Las Vegas alone are 5,000 vehicles in twelve months — half again our whole-fleet first year, before Houston, Dallas, Phoenix or Florida contribute a car.
So run it the other way. Instead of dividing our own total across cities, take Tesla's Clark County number as the benchmark for what a licensed market can do in a year and apply it everywhere Tesla can legally operate without a safety driver — scaled by how many metros each market holds, and started when each one can actually begin. That is the second chart above, and it is our construction, not a Tesla plan:
| Market | Cars in 12 months | Can it start now? |
|---|---|---|
| Austin | 3,000 | Live, flagship geofence |
| Las Vegas | 2,500 | Permit granted 20 August |
| Dallas + Houston | 1,500 | Live, two metros |
| Florida metros | 1,000 | Live, three metros |
| Phoenix | 500 | No permit yet, assumed Q2 2027 |
| Bay Area | 0 | Safety driver required by California |
| Total | 8,500 |
8,500 vehicles in twelve months — 2.6× the 3,315 our own model builds, and 14× the rate the Texas registry is actually adding. Tesla's ambition for one county, taken at face value and applied to the map it already operates, is a far bigger number than anything we have published.
The zero at the bottom of that table is the one to sit with, and it is worse than a locked door.
California authorised more Tesla vehicles than any other state — 1,655 registered under the charter-party carrier permit at the peak around the turn of the year, against 186 in Texas today. But that permit is a limousine licence, not an autonomous vehicle permit: every car needs a human in the driver's seat, and the state's own regulators have said plainly that what Tesla runs there is not an autonomous service. Tesla holds a testing-with-driver permit and has never applied for either the driverless testing permit or the commercial passenger authority that would change it.
The active fleet then went backwards. Independent trackers put the Bay Area at roughly 150–175 cars in service at the early-2026 peak, about 107 in April, and single digits by May — recent plate-tracking logs perhaps a dozen unique Bay Area vehicles across an extended window. Over the same period Waymo was cleared to expand driverless service across 18 California counties.
So California is not a market Tesla is waiting on. It is one it has stepped back from: the largest authorised fleet in the country, shrinking, supervised, and — because the permit applications have not been filed — unable to contribute a single unsupervised car to any twelve-month projection, including ours. Nothing in the public record suggests that changes before the Cybercab has been running unsupervised in Texas for some time.
The only rate anyone has actually measured
Both numbers so far are aspirations — ours and Tesla's. There is a third, and it is the only one that comes from counting.
Texas requires autonomous vehicles to be registered with the state under the rules effective in February. Robotaxi Tracker, which publishes that registry alongside community vehicle spotting, shows Tesla's registered Texas fleet going from 69 vehicles on June 11 to 186 on August 21 — 117 added in 71 days, all Model Y.
That is 1.65 vehicles a day. Annualised, it is 601 vehicles a year. Extrapolating a 71-day window is crude and the ramp is meant to steepen, so treat it as the current run rate rather than a forecast. But it is the one number in this article that was measured rather than asserted, and every other figure here is a multiple of it:
| Rate | Vehicles a year | Against the measured rate |
|---|---|---|
| Texas registrations, observed | 601 | — |
| Tesla, Clark County ambition | 2,500 | 4.2× |
| Our model, all markets | 3,315 | 5.5× |
| Tesla's rate across every licensed market | 8,500 | 14.1× |
Texas is not the whole fleet — Tesla also runs the Bay Area with a safety driver, three Florida metros and now Clark County. But even if every other market together matched Texas exactly, doubling the observed rate gives 1,203 a year, still 2.8× below our own model.
The same tracker is worth reading for a second reason. It shows 154 vehicles in Austin, all of them unsupervised, with 3,374 trips logged and 94 of the 154 active in the last 30 days. That is a materially larger unsupervised count than the mid-teens our own ramp piece reported a fortnight ago, and it moves in Tesla's favour. If it is right, the constraint we have been describing has already loosened — and the number to check on September 3 is not whether unsupervised operation works, but how fast the registry grows behind it.
So the honest ranking is not "Tesla is ambitious and our model is conservative". It is that the measured rate is a fraction of both, and the gap between what is being registered and what either of us assumes is larger than the gap between Tesla and us.
What our model gets wrong in both directions
This is where it would be easy to conclude our model is too slow and move on. It is not that simple, because the same model is too generous somewhere else.
Our robotaxi line starts from 1,000 vehicles in commercial service. The registered fleet in Texas is 186, all Model Y. Our starting point is 5.4× the fleet anyone can actually count, and that assumption is ours alone — no Tesla disclosure supports 1,000 cars in revenue service today.
Measured against Tesla's stated ambition, our rate looks slow. Measured against the registry, it does not: our starting fleet is 5.4× the cars registered, and our first-year additions are 5.5× the rate they are being registered at. Both of our errors point the same way, and it is the generous one.
That is worth saying plainly, because it is our own model and the correction runs against the direction this site's Tesla coverage has been read. We are not going to resolve it by guessing which is right. The bound is this: our model's first-year fleet ends at 4,315 vehicles; the observed Texas run rate, doubled to stand in for every other market, would add roughly 1,200. Those are not the same business, and September 3 is where Tesla can settle it — if it supplies a deployment number rather than a demonstration.
The denominator nobody applies
Here is the part that survives whichever way the rate argument falls. From our fleet-size arithmetic, at $70,000 of revenue per vehicle per year — again our assumption, not a disclosure — it takes 14,800 cars to move revenue by 1%, about 7,000 to add a penny to quarterly EPS, and 12,900 to add one point to the Rule of 40.
Run our entire first year through that ladder:
- 3,315 vehicles is 0.22% of revenue
- 3,315 vehicles is just under half a cent of quarterly EPS
- 3,315 vehicles is a quarter of one Rule of 40 point
Tesla's Q2 operating margin was 1.4% on record deliveries of 480,126. The whole first year of the product the September 3 event exists to launch — on our numbers, which are the more aggressive of the two rates on the table — does not round to a cent of quarterly earnings.
What that is worth at the multiple the market is already paying
Percentages of revenue are easy to wave away, so price it. At the $345.13 close on August 20 and 3,528 million diluted shares from the last annual report, Tesla is a $1,218 billion company on $103.6 billion of revenue over the last four reported quarters — 11.75× sales, or 11.46× on an enterprise basis after the $30 billion of net cash our model carries. On $1.08 of trailing GAAP earnings a share, it is 320× earnings.
3,315 vehicles at $70,000 each is $232 million of annual revenue. Capitalised at the multiple the market pays for Tesla's existing revenue today:
| Cars added in a year | Value at 11.75× sales | Per share |
|---|---|---|
| Observed Texas run rate, 601 | $0.49B | $0.14 |
| Tesla's Clark County ambition, 2,500 | $2.06B | $0.58 |
| Our model, all markets, 3,315 | $2.73B | $0.77 |
| The full Nevada permit, 5,000 | $4.11B | $1.17 |
| Tesla's rate everywhere licensed, 8,500 | $6.99B | $1.98 |
Seventy-seven cents a share — and even the most aggressive construction on the table, Tesla's own ambition applied to every market it is licensed in, is $1.98, six tenths of one percent of the company. Our own model's entire first year of robotaxi, valued on Tesla's own trading multiple, is a quarter of one percent of the share price — and it lands within a dollar of the 33 cents our Nevada piece got by moving the fleet through the discounted cash flow instead. Two different methods, same order of magnitude, which is the useful part.
There is a circularity worth naming rather than hiding. A company earning a 1.4% operating margin on cars does not trade at 11.75× sales and 320× earnings because of the cars. That multiple already contains an expectation of autonomy — so capitalising incremental robotaxi revenue at it is, if anything, generous: it pays twice for the same story. The honest reading is that the market has already priced a robotaxi business far larger than either Tesla's stated ambition or our model builds, and the next twelve months of actual deployment are worth cents against it.
That is not an argument that robotaxi does not matter. It is an argument about when. The line becomes material in year three of this compounding, not year one, and a launch event cannot pull that forward. What a launch event can do is tell us which of the two rates above is closer to true, which is worth far more than the event itself.
What to watch
- A cumulative production or delivery figure on September 3. Our ramp's base case is 400–500 Cybercabs built by end-August. A number materially above that does not close the deployment gap — it widens it, because the constraint was never the factory.
- An unsupervised count from Tesla itself. Community tracking now puts Austin's entire 154-vehicle fleet in unsupervised operation, well above the mid-teens our own earlier piece carried. Tesla has never published the figure. If the event names one, it settles which of those two pictures is current.
- The Texas registry between now and the event. It has added 117 vehicles in 71 days. A step change there is the earliest observable signal that the ramp has started, and it does not require Tesla to say anything.
- Whether Austin gets a rate the way Clark County did. Texas authorises autonomous vehicles by self-certification, so no hearing forces Tesla to state a number. If it volunteers one anyway, it is directly comparable to the 2,500.
- Whether Cybercabs enter paid service or employee service. Those are different events producing different numbers, and our ramp's whole argument rests on the gap between built and validated-unsupervised.
- A California permit application. Not an approval — an application for driverless testing or commercial passenger authority. It is the cheapest available signal that the largest authorised Tesla fleet in the country is coming back into play, and none has been filed.
- Fare mechanics. Any published price per mile or per ride would let the $70,000-per-vehicle-per-year assumption above be tested rather than assumed. It is the softest number in this piece.
If the concentration is the strategy, our curve is the wrong shape
Read the map as a choice rather than as a series of outcomes and it becomes coherent. Texas lets a manufacturer self-certify, so Tesla put the factory, the fleet, the mission control, the first-responder training and the first unsupervised miles in one jurisdiction. Florida and Nevada are cheap to add because they ask for comparatively little. California is expensive, so it waits — and the permits that would start the clock have not been applied for.
That is what building one overwhelming operation in a single state looks like, on the bet that the others adapt to the evidence rather than to a lobbying campaign run in fifty places at once.
If that is the plan, it has a consequence for anyone modelling this, us most of all. The deployment curve would not be a smooth rate compounding across a lengthening list of cities. It would be flat, flat, flat, and then a step — the moment a regulator that was previously closed decides the operating record is sufficient. Our model compounds at 22% a quarter. Tesla's own 2,500-in-a-year is a straight ramp. Neither shape contains a step, and if the concentration thesis is right, the step is where most of the value sits.
We are not going to rebuild the model on a reading of Tesla's strategy; that is exactly the kind of assumption this site is supposed to be sceptical of, and it is ours rather than anything Tesla has said. But it is falsifiable, and cheaply. A California permit application would be the tell — not an approval, which takes years, but an application, which takes a form. Until one is filed, the largest authorised Tesla fleet in the country stays outside every projection in this article, and the whole question of how fast robotaxi scales is a question about one state.
Sources and provenance. The September 3 Austin event date, the invitation-by-sweepstakes mechanism and the August 17–23 ride window are reported from Tesla's own invitation emails via multiple outlets; the event content is unannounced. The "5,000 has always been a ceiling" and "extremely happy and satisfied… 2,500" statements are Tesla's Cybercab chief engineer at the Nevada Transportation Authority general session of August 20, 2026, as reported from the hearing — statements at a hearing, not guidance in a filing, and specific to Clark County. The 5,000-vehicle Nevada permit was approved by the Authority on August 20. Cybercab staging counts (102 in June, ~245 peak in mid-July at Giga Texas; ~140 Houston, ~105 Dallas, ~14 Charlotte in early August) and the 186 registered Texas robotaxis are crowd-sourced spotter and registry observations, not company figures; registered vehicles are not the same as vehicles in daily service, and vehicles move between sites. The starting fleet of 1,000 vehicles, additions of 600 a quarter compounding at 22%, $30,000 of revenue per deployed vehicle per quarter and $70,000 per vehicle per year are all assumptions in our own Tesla model, not Tesla disclosures; the 3,315 first-year additions, the 4,315 first-year fleet, the 75% share and the 1.33-metro figure are arithmetic on those assumptions. The per-market scenario totalling 8,500 vehicles is ours: it applies Tesla's stated Clark County ambition as a per-market benchmark, scaled by metro count and offset by licence timing, and Tesla has published no per-city deployment plan. California's status is the reason the Bay Area contributes zero: Tesla operates on a charter-party carrier permit requiring a safety driver, holds only a testing-with-driver autonomous permit, has not applied for driverless testing or commercial passenger authority, and state regulators have stated the service is not autonomous. The 1,655 California vehicles registered under that permit at the peak, the roughly 150-175 active at the early-2026 peak, about 107 in April and single digits by May, and the dozen or so unique Bay Area vehicles in recent plate-tracking logs are independent tracker and regulator-filing figures, not Tesla disclosures; Tesla publishes no active fleet count anywhere. Waymo's clearance to expand driverless service across 18 California counties is a state approval on the public record. The Texas autonomous-vehicle registration figures — 69 registered on June 11 and 186 on August 21, all Model Y — and the Austin figures of 154 vehicles tracked, 154 unsupervised, 3,374 trips logged and 94 active in 30 days are published by Robotaxi Tracker, which aggregates the state registry and community vehicle spotting; the 1.65-a-day, 601-a-year and 1,203-a-year figures are our straight-line arithmetic on that 71-day window and are not forecasts. The 14,800 / 7,000 / 12,900 vehicle thresholds are our own arithmetic from the fleet-size piece. The $272.39 base case and the 33-cent permit sensitivity are from our Nevada piece, priced against a $351.12 close on August 19. Q2 2026 deliveries of 480,126 and the 1.4% operating margin are from Tesla's own quarterly release. The $345.13 price is the August 20 close and will not be the number you see today; the 3,528 million diluted share count is from the FY2025 annual report; trailing revenue of $103.62B and trailing GAAP EPS of $1.08 are the sum of the four most recent reported quarters. The 11.75× sales, 11.46× enterprise-value-to-sales, 320× earnings multiples and every figure in the valuation table are our arithmetic on those inputs, and capitalising robotaxi revenue at Tesla's blended multiple is an illustrative convention, not a valuation method the company or any analyst has published.